

Embracing Risk Part II: Self-fulfilling Prophecies
Risk-intolerant investing drives a negative feedback loop that causes real underperformance

This article is a companion piece to my recent article “Embracing Risk”. While not strictly necessary, if you have not already, I encourage you to read that one first to place some of the ideas presented here in context.
You have probably heard, at some point, that Canadian startups on average raise less money and return smaller multiples for investors than American startups. The Logic gets into it, as do many others. The natural but probably wrong conclusion is that Canadian startups are less capable, in some sense, than their American counterparts. The problem with the simplistic conclusion relates to sample size.
Once upon a time, I got into a friendly argument with a colleague over chess rating statistics while drinking the truly awful beer that fuels grad school. Their assertion was that, given that men make up the vast majority of top-ranked chess players globally, men must be better than women at chess. I disagreed, on the grounds that there are far fewer women who play chess professionally than men, and that one would expect that underrepresentation to be reflected at all levels of play.
Being the nerd that I am, I had to prove my assertion with data to satisfy my own curiosity. You can see the ensuing Stack Exchange thread here. I will not reproduce the analysis, but in a nutshell, the data bore out my argument. Men outnumber women in rated chess play by a ratio of about 23:1. When you sample a distribution, the number of outliers you will draw increases with the number of samples you draw, and so you expect that the top spots to be dominated by samples from the larger population.
When comparing outlier performance between two populations, it is not enough to simply compare directly and conclude that the population that has more and larger outliers is represented by a different underlying distribution with a larger average, unless you are certain that the sample sizes are the same. Even two samples drawn from the same underlying population can exhibit significantly different performances when sample sizes differ.
[[As an aside, the quick and dirty analysis I did at the time suggests that top-10-ranked women actually tend to overperform expectations once sample size effects were accounted for. To put this in more concrete terms, all else being equal (which is to say, if the imbalance between men and women remains the same as it currently is), we expect a Magnus Carlsen-level male chess player to be born every 30 years or so. In contrast, given the level of underrepresentation of woman among grandmaster chess players, Judit Polgár is a once-in-a-millennium chess mind.]]
Under-sampling creates an illusion of relative underperformance
The demonstration of the impact of chess ratings suggests that we should be very careful with comparison of population outliers, which are what matters when considering startups. Given that there are fewer Canadian startups than there are American ones, and given further that startup performance is dominated by outliers, we are likely making the same mistake as many do when considering chess performance. Apparent Canadian startup underperformance relative to American startups may simply be a sample size effect.
In other words, it can be true both that American startups and Canadian startups are equally performant (in the sense of being drawn from the same underlying value distribution), and that a Canadian startup will probably never be top-ranked by valuation at any given time when considering both ecosystems together. The resolution of the apparent contradiction lies in the fact that there are just more American startups than there are Canadian ones.
No comparison that I have ever seen of the two ecosystems has attempted to take this into account. Various explanations of this have floated around for a while, including some particularly silly ideas about culture, but I have not yet come across any attempt to rule out the most obvious issue: that the sample sizes are vastly different. While I do not have the data to find out if this is able to explain the entirety of the problem, it is certainly part of it, and, as I argue in the rest of this post, it is probably a core element of the cause of issues that compound the problem.
Perceived under-performance is a self-fulfilling prophecy
It gets worse, because perception of underperformance is a self-fulfilling prophecy. Investors considering allocating their assets care only about measurable performance, meaning that an investor with the option to invest on either side of the border and no preference, all else being equal, will invest preferentially in American companies, increasing the availability of capital and increasing the chances of success in that ecosystem - effects which will drive real differences in the underlying distributions. In other words, under-sampling creates a negative feedback loop in which the expectation of performance differences makes them real. This prophecy is played out in several ways, including difficulty raising money in Canada, as well as a tendency for highly successful Canadian founders to have companies that are based in the US.
Under-sampling power laws causes real underperformance
When considering return on investment for startups there is another, much less intuitive complication not present in the case of chess ratings that needs to be considered, which arises from the asymmetric nature of the power law. While the distribution of chess ratings is symmetric about the mean, the power law that dictates startup value is about as asymmetric as it is possible for a distribution to be. This matters, because when we draw a sample population from a symmetric distribution, the distribution of the population average is itself symmetric, and its median and mean therefore independent of sample size.
In an asymmetric distribution like the power law, this is not the case. The distribution of the population average remains asymmetric up to quite large sample sizes, and smaller populations actually have a distribution of population averages that is skewed toward smaller numbers. The smaller your sample size, the worse the average performance of that population, and vice versa. (For the stats nerds out there: the central limit theorem guarantees that for a sufficiently large sample size, the distribution of the average will converge to a symmetric Gaussian distribution, but different underlying distributions dictate very different values of “sufficiently”, which matters here.)
Restating this in investment terms: if you are investing in power-law distributed assets like startups, up to a point, you can increase the median performance of your portfolio simply by making it larger. The converse is also true: by making fewer investments, you are actually driving a real, absolute reduction in expected outcomes. This is not just an illusion of relative underperformance caused by under-sampling, it is real underperformance driven entirely by sample size.
The following plot shows the impact clearly. Using the same distribution parameters as presented in the Moonfire article for the multiplier on ROI, I draw 10,000 examples of populations of the size given on the x axis, and for each population size I plot the boxplot of the distribution of the sample average of these “portfolios” (you can interpret the y axis as the average multiplier returned by each company in a portfolio of N companies, with N given on the x axis, with the boxplots showing the quartiles of the resulting distribution portfolio averages).
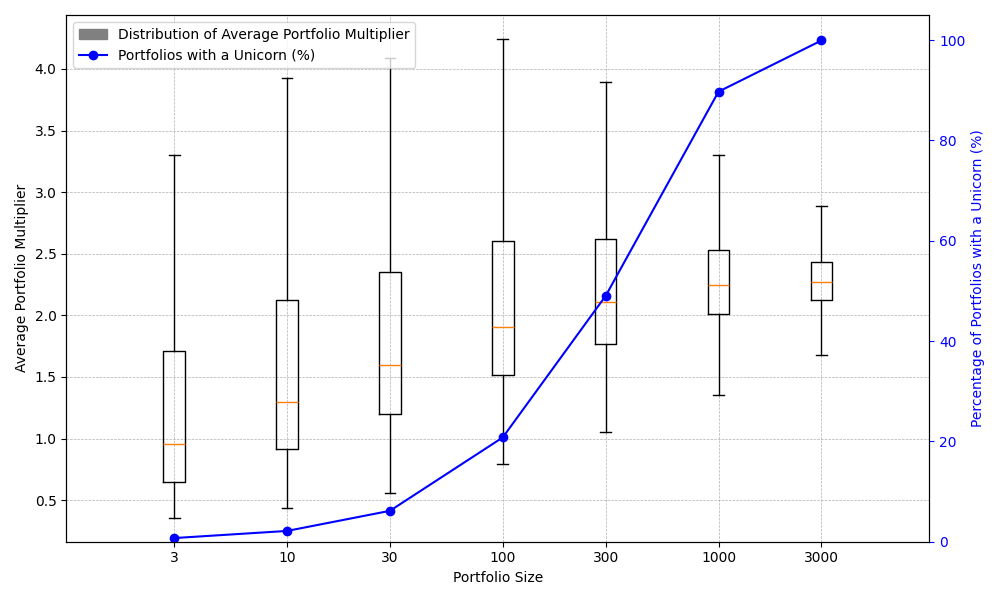
A value of 1 on the left y axis is the point at which an investment portfolio breaks even, on average, but the absolute numbers are not all that important (they are drawn from a distribution with realistic but arbitrary parameters that reflect qualitatively the underlying distribution, not necessarily quantitatively, and we are obviously ignore the impact of time in this simplistic analysis). What is important is that the median of the distribution of portfolio averages (orange line) is an increasing function of portfolio size until we reach portfolio sizes that are orders of magnitude larger than typical VC portfolios.
We tend to implicitly assume that averages are independent of population size, while variability goes down as it gets larger, but this is only true for symmetric distributions (or for very large sample sizes). For power laws and other heavy-tail distributions with smaller sample sizes, or any situation in which it is the outliers that we care about, both the sample average and sample standard deviations are strongly sample-size dependent until the sample size is very large.
The secondary y axis on the right shows the fraction of population samples that have at least one portfolio company that returns a multiple that exceeds 100, which we use as a proxy for the fraction of portfolios that hit at least one homerun. You can see that once for small sample sizes you are all but guaranteed to miss, but as this probability goes up, the median performance approaches saturation, which is just another way of seeing that all that matters when making investments is not missing the homeruns.
For this specific example distribution, a Blind Squirrel investor needs about 300 investments to be made before the sample size effect goes away and average portfolio company performance saturates. This is the core of why the Moonfire model found that best performance occurred when deploying all their capital in the first round - by considering portfolio sizes below this threshold, they are operating in a regime where extra portfolio performance could be extracted simply by making more investments.
With power laws, under-sampling causes real underperformance.
How does this get reconciled with traditional VC?
The obvious question, given the above, is “how can VCs still operate with portfolios of 20-50 companies?”. For a given niche, and at a later stage, it is actually possible to pick winners to some extent. What this means in mathematical terms is that in some narrow circumstances, it is possible to change the underlying distribution to a power law where average performance saturates for smaller portfolio sizes (mostly this is about reducing the exponent in the power law). B2B SaaS and biotech, the two sectors where VC has proven effective, are these niches. Later stages of investment across a broader set of companies (series A and beyond, for example) also have distributions with reduced exponents. In these cases, VC can be successful because it is possible, to some degree, to pick winners and bias the pool of possible investments toward a more forgiving power law.
That being said, I suspect that in most cases, VC performance would similarly be augmented through larger portfolio sizes, which may be one of the drivers behind the trend toward larger and larger VC funds generally, though compensation structure also plays a role there since the 2 and 20 rule increasing frontloads reward as fund size goes up. The limitation here is due diligence times - changing the exponent that drives the power law is a lot of work.
This generalizes poorly to making early investments in emerging technologies and deep tech, though, and this is the reason that traditional VC does poorly here relative to B2B SaaS. Picking winners (by which I mean reducing the power law exponent) is much more difficult in the earliest stages and in sectors for which the metrics used by traditional VCs to perform valuation break down. Here we are at the mercy of the underlying power law, but we can use our statistical understanding of the impact of sampling to correct for challenges with picking winners.
Emerging Technologies
Where emerging technologies are concerned, if we acknowledge that there is not much we can do to predict technology portfolio value early, the only winning move is to take the Blind Squirrel approach and invest broadly. This is the core of why I am a strong advocate for risk-tolerant, philanthropic investment approaches that partner public and private sector capital toward a common goal. These approaches can tolerate long timelines, can consider the value of positive spillovers that are missed by traditional VC, and, most importantly, can place lots of bets. Les Deep Tech in France are taking this approach, with am ambitious goal of creating 5000 deep tech companies over the next 10 years. I do not need to know the details of the value distribution from which they are drawing to know that they are operating comfortably in the regime of maximum average performance. The SBIR in the US similar supports thousands of emerging technology companies every year, with excellent aggregate results.
For policy makers and those seeking to support emerging technologies, the important point is to recognize that underperformance of Canadian deep tech (either relative to the Americans or in absolute terms) is the result of a self-fulfilling prophecy that reinforces the systemic risk-aversion that leads to that underperformance in the first place. It is at least partially, and possibly entirely, because of risk-aversion-driven under-sampling that Canadian startups underperform. Breaking this cycle requires an active choice to take more risks, and the math tells us that we will be rewarded for doing so.
In other words, our innovation policy frameworks have cause and effect precisely backwards. Risk-intolerance is a direct cause of real underperformance, not the other way around. Canadian deep tech and emerging technology startup underperformance can be remedied simply by embracing risk and investing broadly, and staying the course long enough to see the impact.
Preach! 🙌